Product Innovations at Tableau Conference 2024


At Tableau Conference 2024, we shared how you can start with data and move forward with Tableau with all of the new product innovations we announced—from generative-AI-powered semantics for trusted insights, embedding in your flow of work for actionable insights, and reusable and composable assets.
Devs on Stage showcased exciting new features that push the boundaries of data and governance, analysis and visualization, and platform and embedding. For the first time ever, we previewed DataDev innovations, showing how they’re scaling and extending the Tableau platform to new and exciting frontiers. We can’t wait to see how the Tableau Community uses these future functionalities.
The next generation of Tableau is being built for you—our customers, partners, and community. Check out all the innovations that were shared at Tableau Conference 2024.
Local file save with Tableau Desktop Public Edition
To further our mission of helping everyone see, understand, and act on data, we’re expanding on Tableau Desktop Public Edition to allow users to work with and save workbooks securely and locally, in addition to sharing it online with the Tableau Public community. Now, even more learners, data enthusiasts, and non-profit users can explore the data that matters to them most.
Viz Extensions
Powered by Tableau-native and community-built viz extensions, it’s never been easier to build custom visualization types directly from the Marks card, including Sankey, Sunbursts, Chords, Beeswarms, and more. The Sankey extension, for example, allows you to build this rich visualization in just three clicks.
Data Cockpit
Essentially air traffic control for your data, Data Cockpit gives you unparalleled insight into Data Management. It answers Tableau administrators’ most frequently asked questions about who's contributed to the site, the data being used, whether or not that data is certified, and more.
Composable Data Sources
You asked, and we answered: now you can join published data sources! Composable Data Sources help you create a single source of truth. You can enrich centralized, certified data with additional context as a derived, dependent data source without the risk of impacting certified data. This means that changes made upstream to centralized data automatically cascade to analysts’ data sources downstream, keeping them updated and in sync—which also saves you precious time and money in data egress.

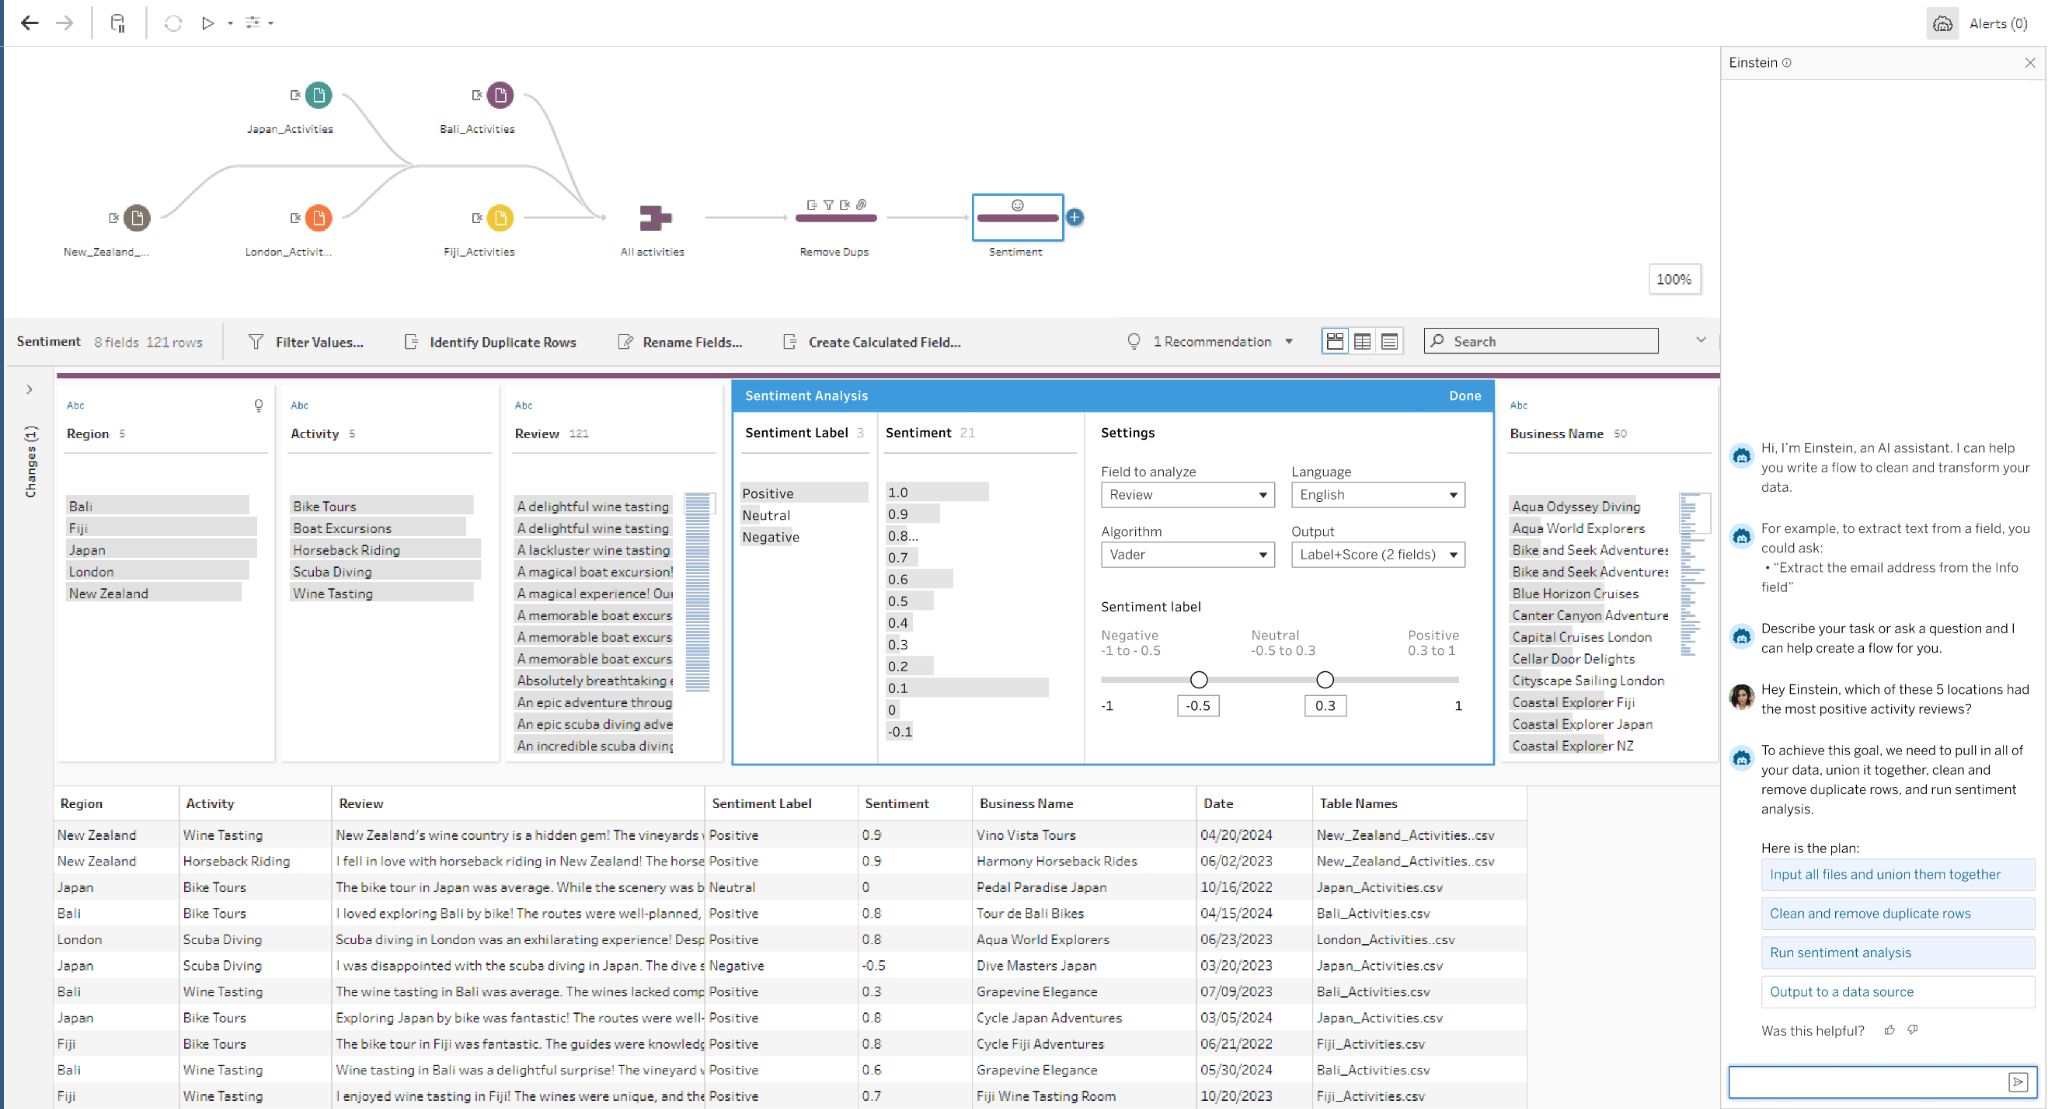
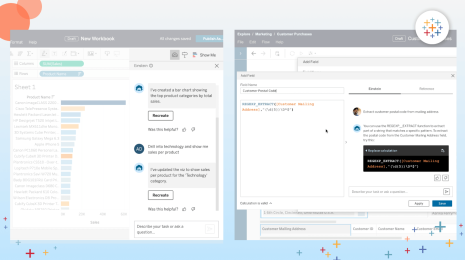
Einstein Copilot for Tableau Prep and Sentiment Analysis
AI-powered Einstein Copilot will be available for Tableau Prep and Tableau Catalog. With the power of Einstein, you can calculate sentiment of raw text data and blend it together, getting a complete flow. Sentiment Analysis helps you to gain valuable insights on columnar data.
Einstein Copilot for Tableau Catalog
With one click of a button, Einstein for Catalog generates a detailed summary using metadata and field names. This generates a relevant, contextualized description of the data sources so that anyone understands the underlying data, and site admins can certify the data.
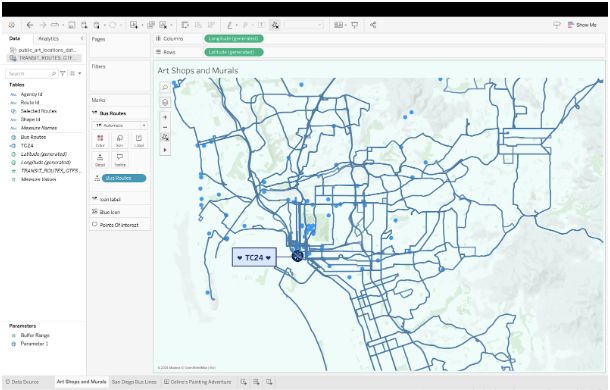
Spatial Parameters
Enabling you to fine-tune the proximity between locations, Spatial Parameters offer geocoding at the address level and distance or buffer analysis. Imagine what businesses can do with this feature. For example, franchises can map overlap and outreach for Direct Mail, or drive supply chain optimization using data.
Google Fonts
New, web-safe Google Fonts that work on Tableau Cloud and on the web are available, offering the functionality to reformat your dashboard to your company’s branding in seconds. This is readability, simplicity, and cross-device compatibility.
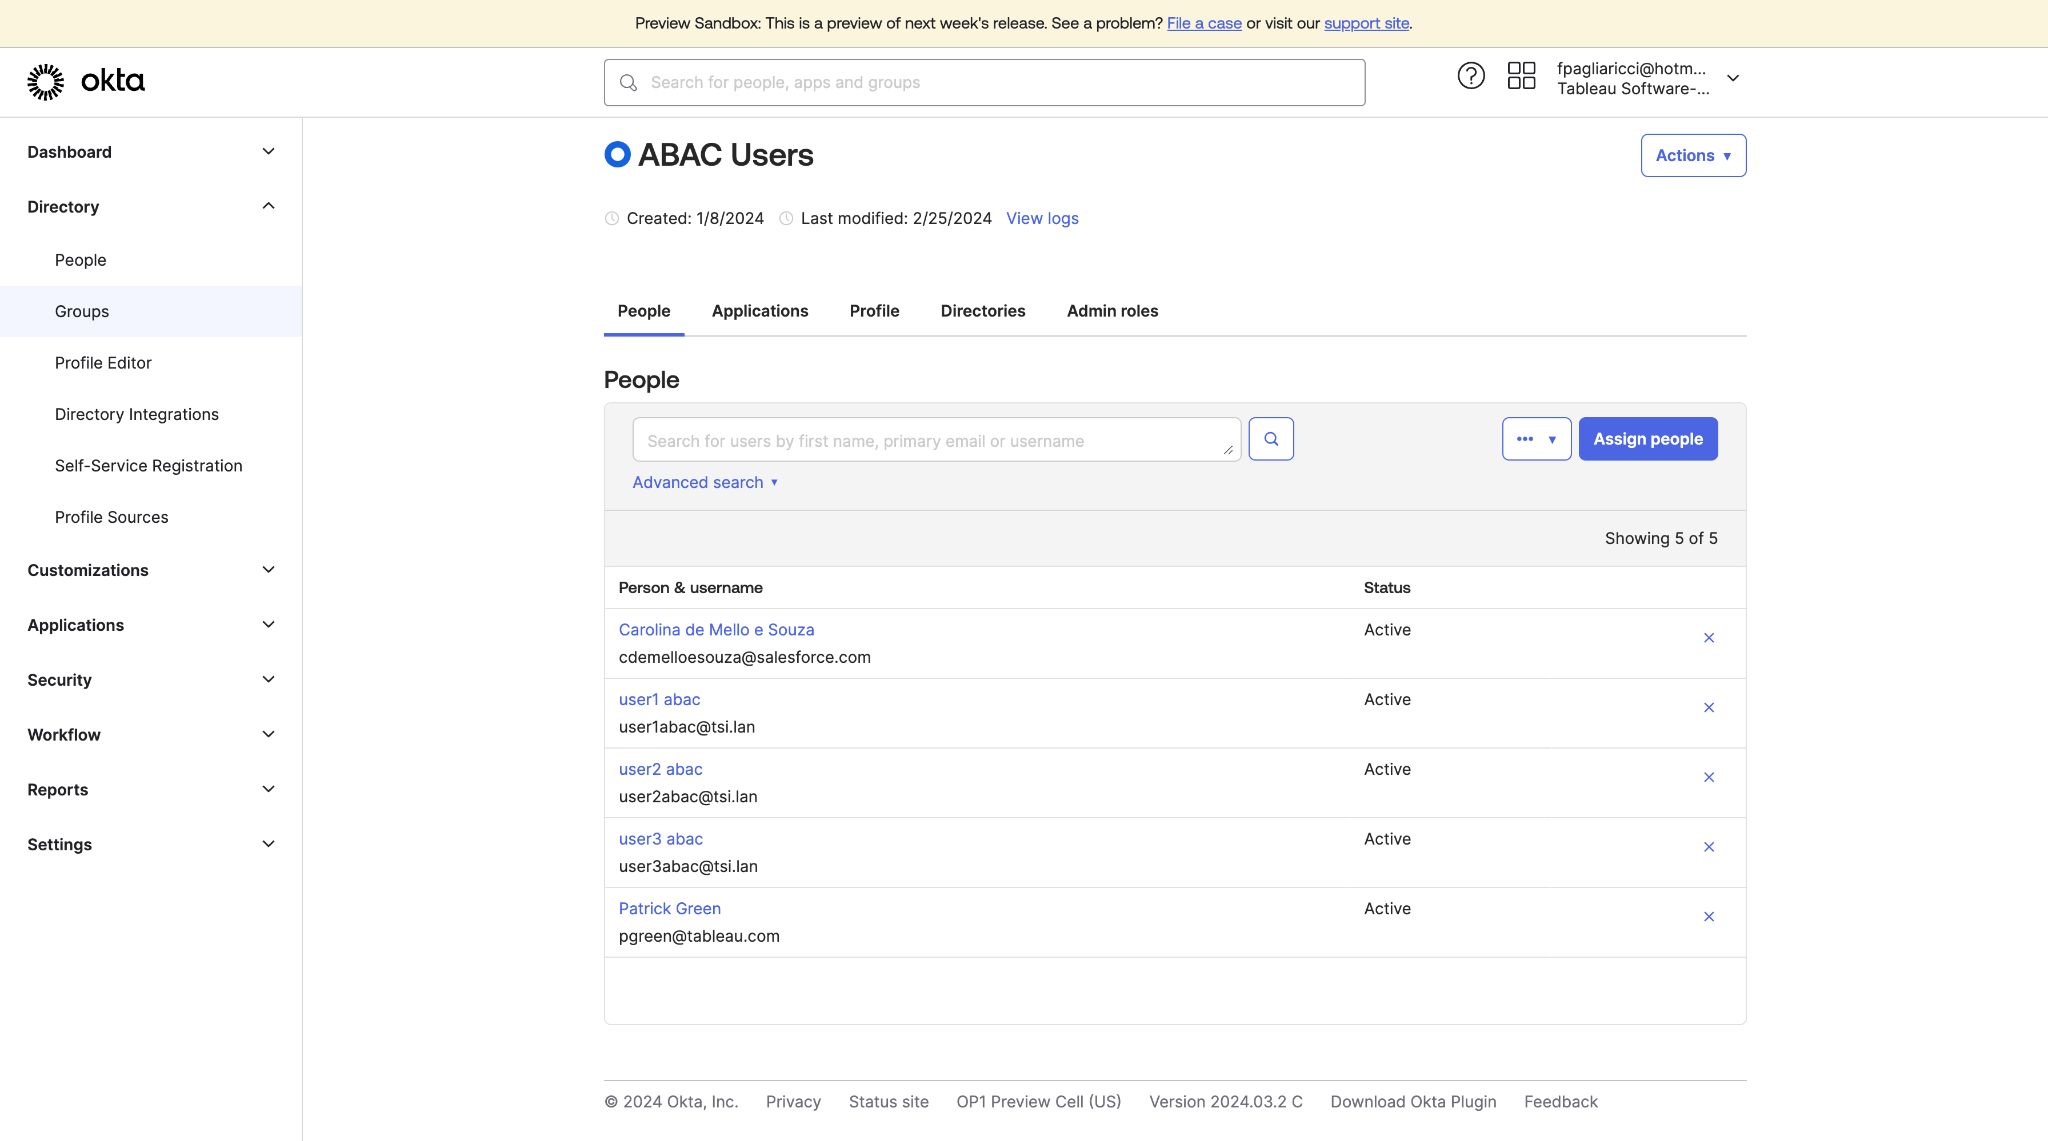
Attribute Based Membership (ABAC)
Showcasing group membership improvements, Attribute-Based Membership dynamically manages authorization using groups. It can save site admins time by leveraging metadata from your identity provider. With ABAC, it all just works.
Localization via User Attribute Functions
Thanks to User Attribute Functions, dashboards can be translated to the language of your choice, so that you can interpret data in your preferred language.
Tableau Pulse Metrics in Dashboards
By adding Tableau Pulse to your dashboard, you get customized metric cards and insights embedded onto your site. For example, you’re able to choose between different card and BAN layouts, finding new ways to leverage Pulse in the flow of work.
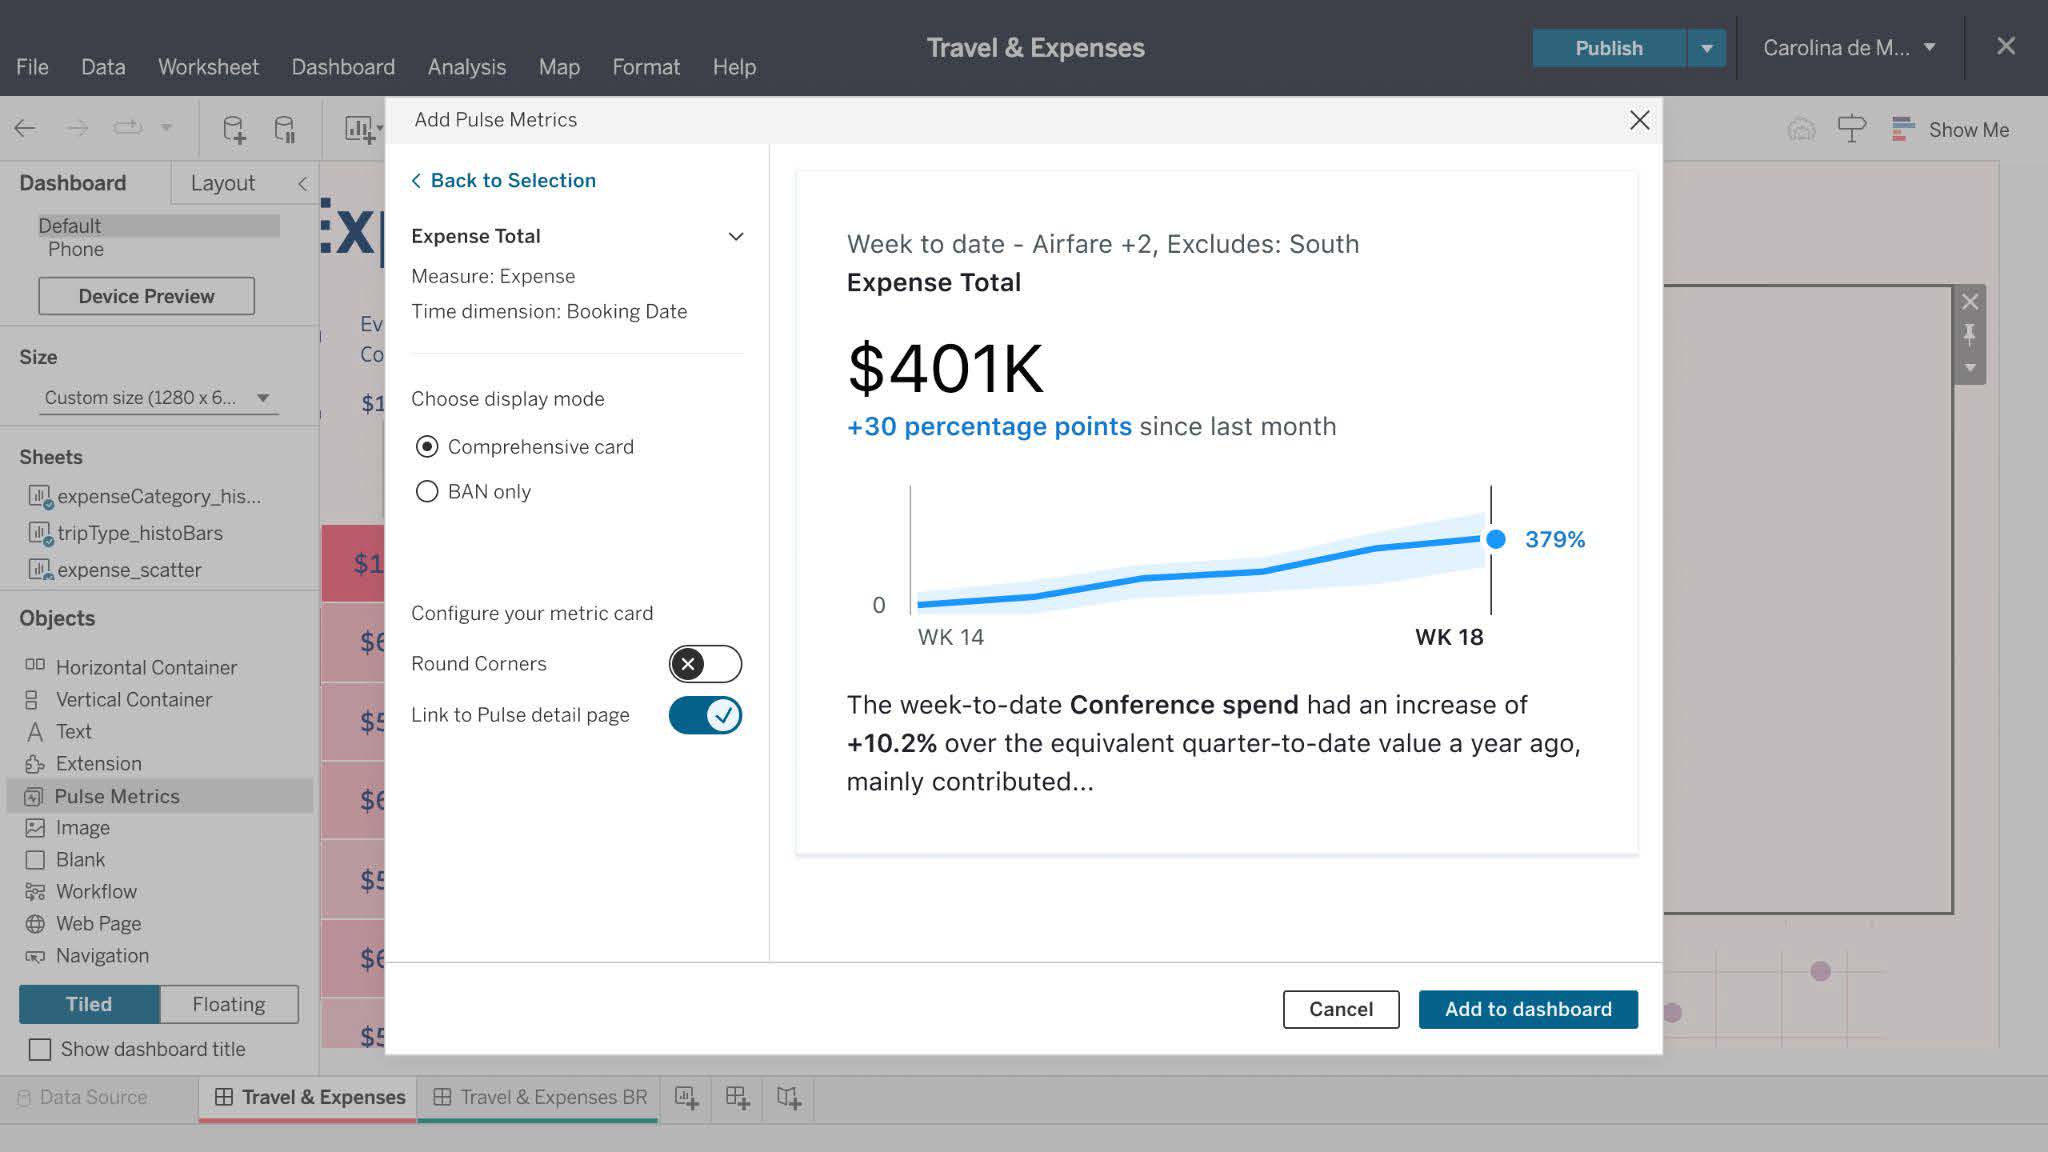
Tableau Pulse for Microsoft Teams
Timely and relevant insights right in the flow of work—wherever you work—which includes Microsoft Teams. Now you can embed Tableau Pulse insights in Microsoft Teams.
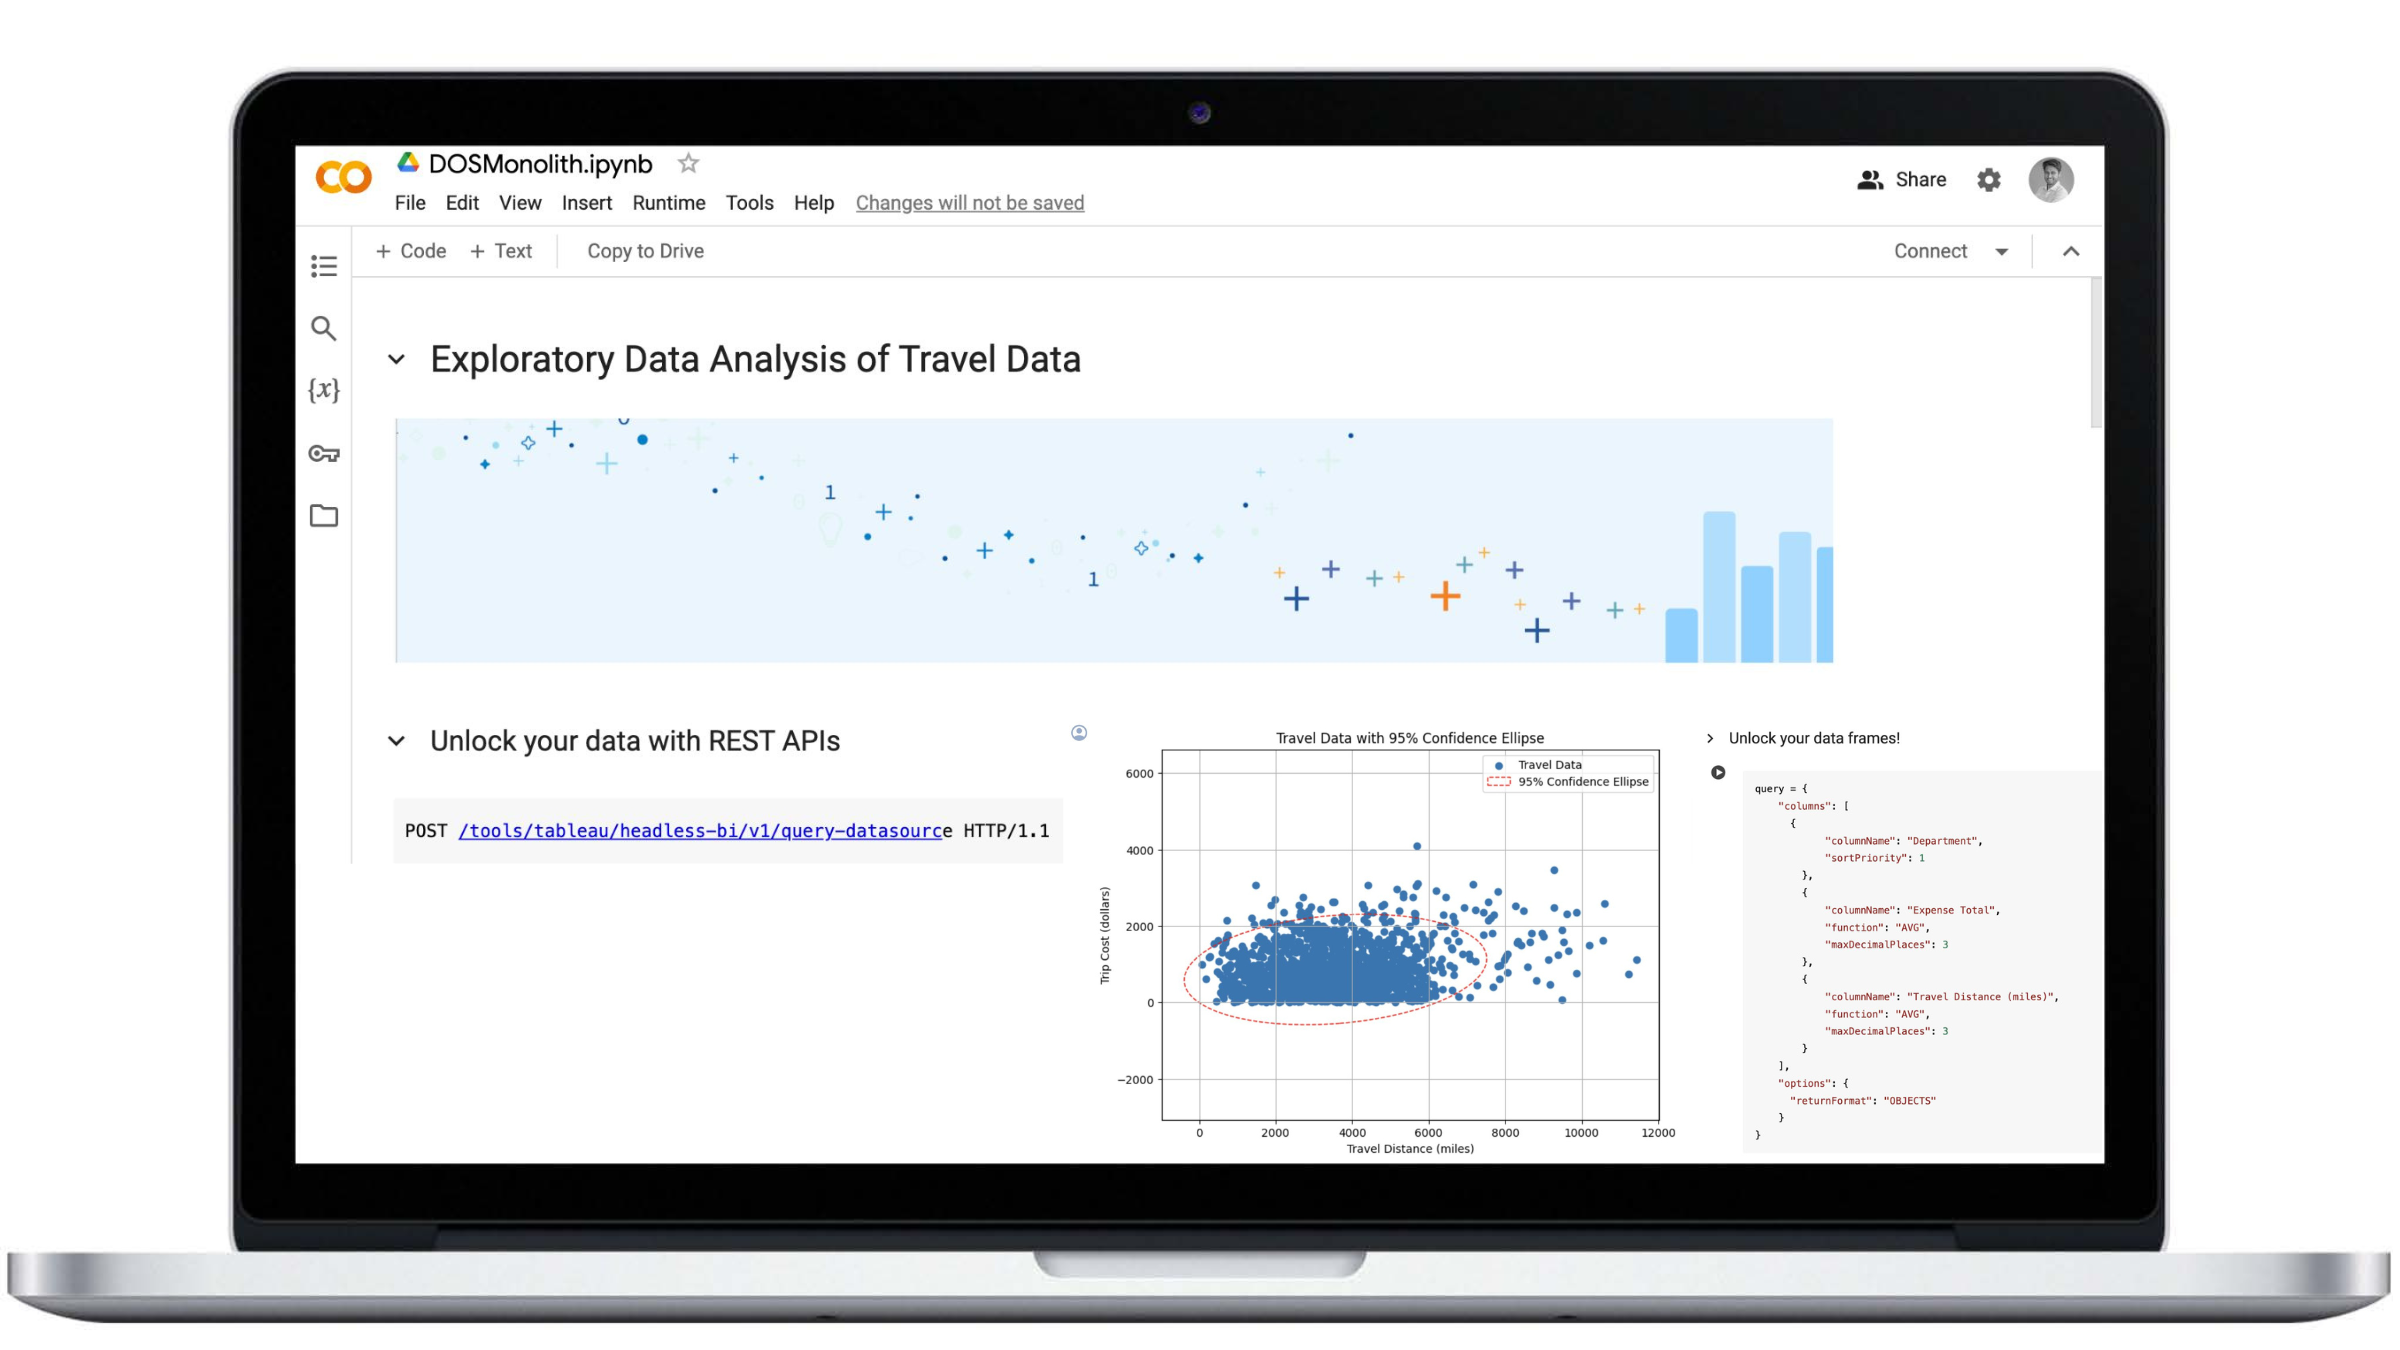
Headless Business Intelligence (BI) - VizQL Data Service: Jupyter
Using Headless BI, customers can unlock the power that a secure, trusted data source can provide. It can enable a wide spectrum from complex data analysis such as elliptical regressions using a Jupyter Lab notebook to something as simple as a data frame, and beyond.
Headless Business Intelligence (BI) - VizQL Data Service: Apple Watch App
Designed for the admins and devs at heart, Headless BI helps data scientists leverage Tableau like never before. Developers, rejoice! Build custom apps like an Apple Watch experience to monitor travel and expense on the go, for example.
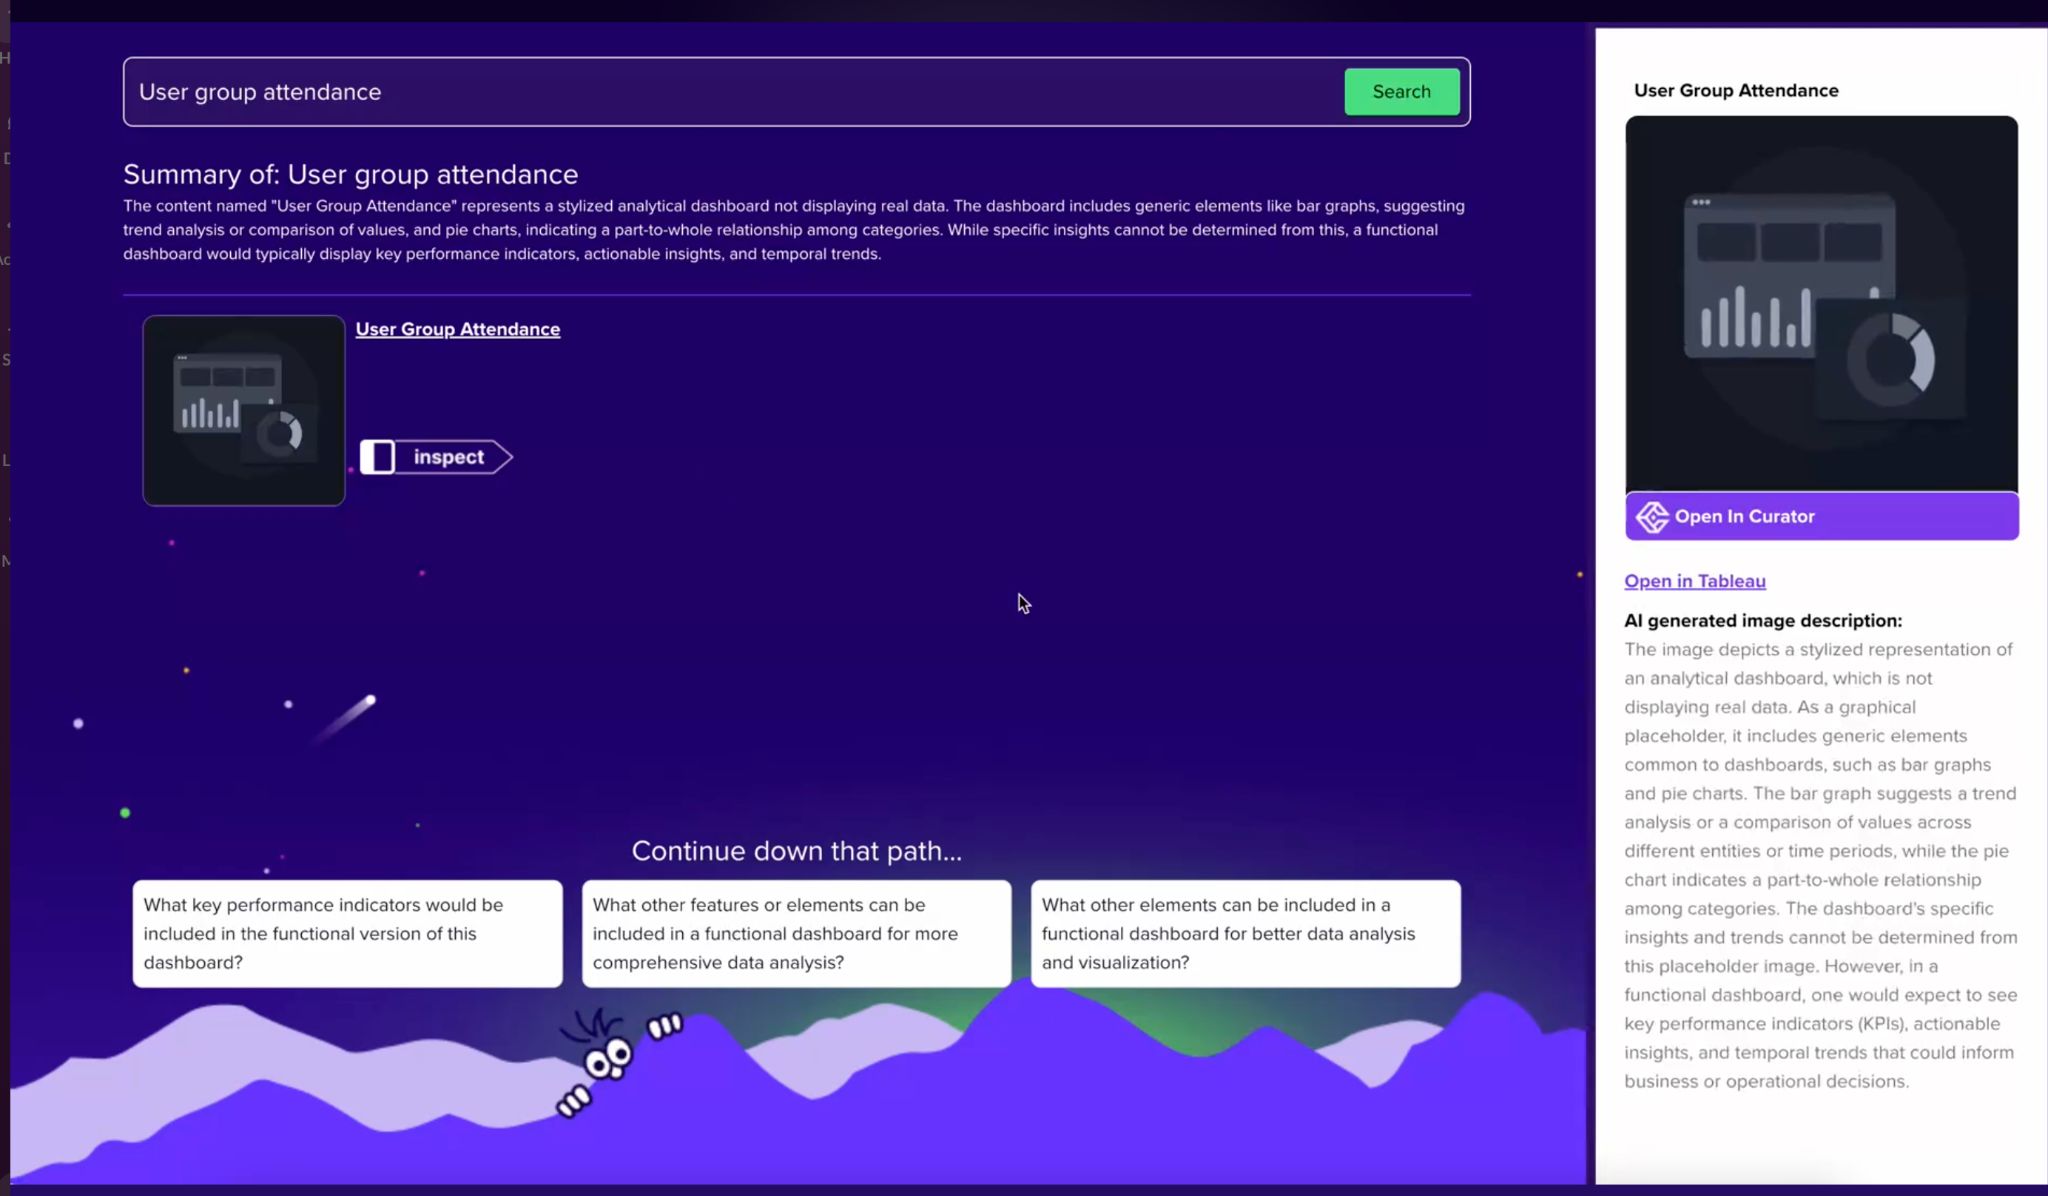
Curator AI Search from Interworks
Curator Search from Interworks helps you find Tableau User Group (TUG) information, membership metrics, data, and existing dashboards—even information outside of Tableau—across your center of excellence.
Figma to Tableau Plugin: Next Gen from LaDataViz
Figma templates can be exported directly to Tableau, enabling you to build stunning, standardized dashboards in minutes—not hours.
PowerKPI from Infotopics | Apps for Tableau
This viz extension allows you to explore data hierarchically, a novel way to drill into data, to reveal deeper insights.
SuperTables Viz Extension from Infotopics Apps for Tableau
This viz extension can correct errors in the source data, like typos, updating the dashboard in real time.
Watch the Tableau Conference Keynote and Devs On Stage
Making data and insights accessible to everyone and achieving our mission aren’t things we can do alone. We're grateful for you, our customers, partners, and the Tableau Community for over 20 years of inspiration. Thank you, and I can’t wait to see what we accomplish in the next 20 and beyond. Together, Tableau’s future is bright.
Watch the Tableau Conference 2024 keynote.
Histórias relacionadas
Who is Einstein Copilot for Tableau for?
 10 Abril, 2024
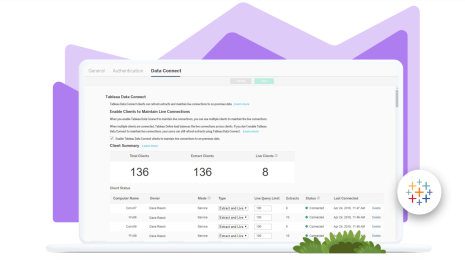
Securely Access and Analyze All of Your Data with Data Connect for Tableau Cloud
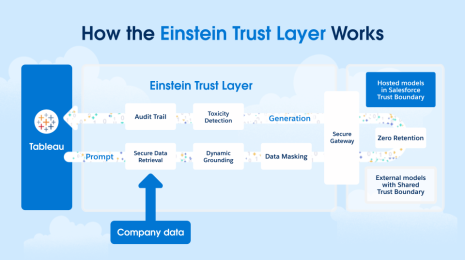
How Can I Trust Einstein Copilot for Tableau?
 2 Abril, 2024
Subscribe to our blog
Receba em sua caixa de entrada as atualizações mais recentes do Tableau.