Learning Tableau Helped Me Land My Dream Job in the Music Tech Industry

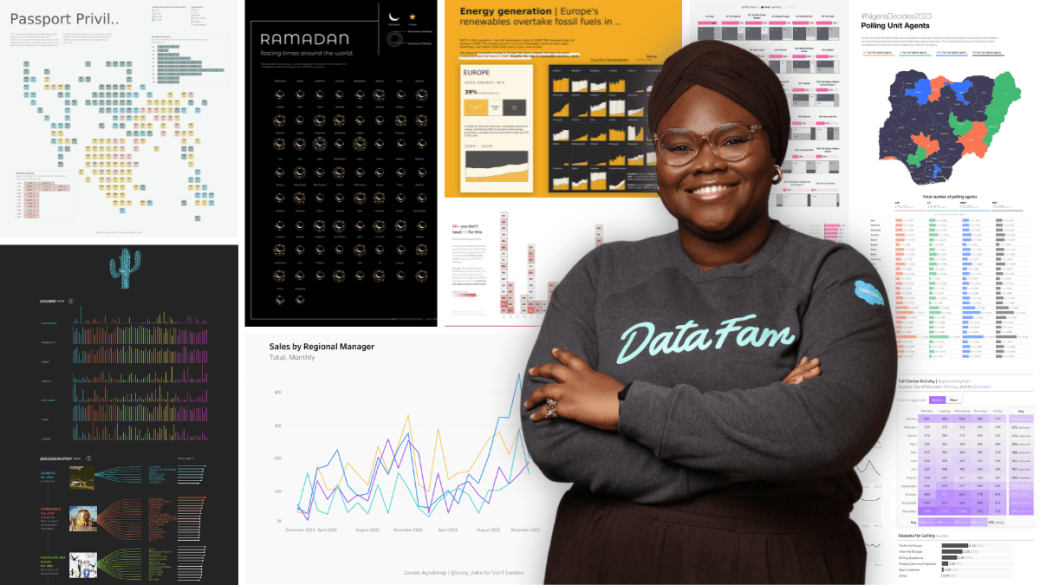
Zainab Ayodimeji started using Tableau in 2020 and has since become a three-time Tableau Public Ambassador and six-time Viz of the Day recipient. Zainab is a data scientist in the music technology industry and currently resides in the UK.
How did you become aware of Tableau?
Zainab: The first time I saw Tableau was through an online statistics introductory course I took while studying for my engineering master’s degree in the UK in 2018. At the end of the course there was a small section about visualizing data with Tableau. I thought it sounded cool so I checked the website for more information. I saw the Viz of the Day, and I was like, “Oh, my God. How did anybody do this?”
After the course, I got into data science and was doing a lot of data stuff, but I didn't use Tableau. I was aware of it, but I just never used it.
From there, how did you become involved with Tableau and the Community?
Zainab: In 2019, I came back to Nigeria where I'm originally from, and I got a job as a data analyst. I was interested in connecting with the Community in Nigeria. And so I met Abisola Oni, the first Tableau Visionary from Africa through a meetup she founded. She was an Ambassador through and through because she would always talk about this awesome Tableau Community, but I just never looked into it. Then the Covid lockdown happened.
During lockdown, I discovered Sarah Bartlett, she's now a Visionary, too. She came to give a virtual talk at the meetup, and she was talking about the Tableau Community. Before the meetup, they asked us to prepare some visualizations for Makeover Monday, so Sarah could give us feedback.
I prepared a viz to present, Sarah gave me constructive feedback which I implemented, posted on Twitter and tagged her. She must have been impressed that I did that because she gave me a #TableauFF (Follow Friday) shoutout on Twitter the following day. Tableau Follow Fridays is a hashtag the Tableau Community uses to amplify new members and their profiles on social media.I started connecting with the Community through that tweet as I was able to follow and interact with her followers.
What was building your first viz like?
Zainab: My first viz was one that I did with the course—it was very simple. What I consider my actual first viz was the one I presented at the meetup for Sarah. Initially, I did not know what I was doing but I went with the flow, got inspiration from Tableau Public, and I remember being impressed that I could add things like images and background color to my dashboard. The initial feedback Sarah gave me was very kind and constructive that I truly thought it was everything!
The feedback itself included minor changes about dashboard and color usage, but I say that “it changed my life” because what it did was open my eyes to the world of what was possible in terms of design and formatting with Tableau. It led to my community involvement, mostly on Twitter, and has shaped my career as a data scientist today.
When did you know you wanted to incorporate Tableau into your career path?
Zainab: Because I started in 2020 during lockdown, using Tableau for visualization became my “lockdown hobby.” I was getting better at it every week and understanding the value of visualization to unearth insights even more.
At my job, we did a lot of analyses that mostly lived in Excel sheets or Jupyter notebooks which weren't easily accessible to non-data scientists and other stakeholders, so on a random day I thought, “Why can't we just have a dashboard?” It seemed like a perfect use case, so I introduced Tableau to the company, and we got our first license. From that point, it was clear Tableau had real value in the business environment, and I have not looked back since.
What have been some of your favorite vizzes and proudest accomplishments?
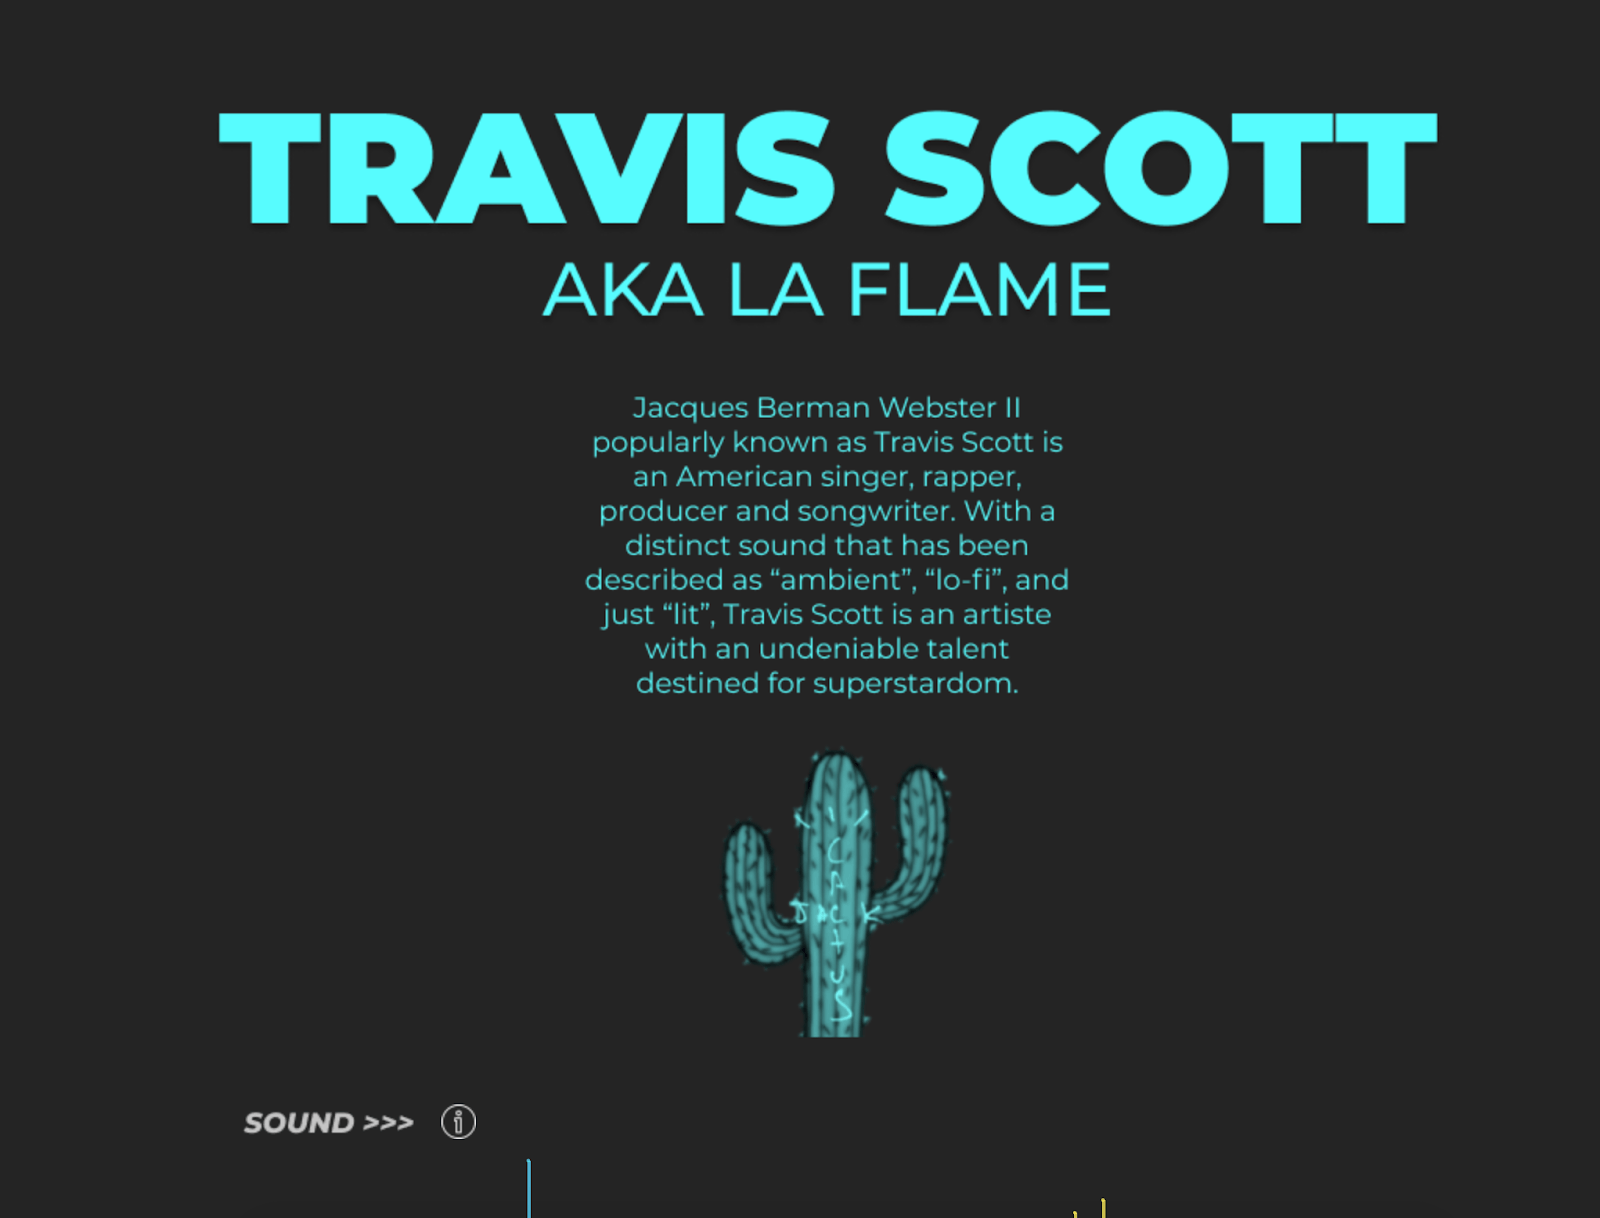
Zainab: I love music, so I took my favorite artist at the time, Travis Scott, and decided I was going to visualize his discography for my first personal passion project.
From getting data sources to thinking about how I wanted it to work, the entire process was new to me. I spent months trying to figure out the layout, design, color, and more, but at some point, I decided I was just going to publish it, which I did, and got amazing feedback.
The turning point for me was when it was published in the Tableau Public Virtual Viz Gallery—I was really, really excited. I felt so proud because I worked hard on it, so to get recognition on such a big platform was mind-blowing for me.
It helped you get your job in the music and technology field, yes? Do you still use it every day?
Zainab: My current manager saw it shared on LinkedIn, and he messaged me, “I saw your work and Tableau profile online. I love your dashboards and I really think you should apply for this role.” I was stoked and applied even though I didn't think I was qualified, but I got the job!
I use Tableau almost every day. My job involves communicating insights, trends and patterns from data in an easy and visually impactful way. Beyond visualization, I connect with stakeholders and try to figure out what they want to see and design with user experience in mind. I consume dashboards myself and use them to make decisions in my day-to-day work.
How are you involved with the Community today, and what are your goals for the future?
Zainab: Being a Public Ambassador is inspiring to so many people in ways I can’t even imagine. I get messages every other week from people with so many diverse backgrounds saying, “Hey, it's great you're doing this. You've inspired me.” I'm Nigerian, and you don't see a lot of people like me in this global space.
So yes, a lot of students and professionals looking to switch careers reach out to me, and that's the most rewarding part of being in the Community, being able to pass down the help and support that was extended to me when I joined. I currently have some mentees, so I’m hoping to inspire others and teach more.
If somebody was on the fence about getting involved with the Community, what would you tell them?
Zainab: Go for it. You can do it. And don't be overwhelmed. There are people at different levels of expertise from different places all over the world. In this Community, everybody’s really kind so don’t feel too ashamed or shy to put yourself out there. What's the worst that can happen?
関連ストーリー
Subscribe to our blog
Tableau の最新情報をメールでお知らせします


