 Tableau Public
The Tableau Public Viz Gallery at Tableau Conference 2024
 29 Abril, 2024
Explore the 2024 Viz Gallery featuring 31 captivating vizzes from global creators.
29 Abril, 2024
Explore the 2024 Viz Gallery featuring 31 captivating vizzes from global creators.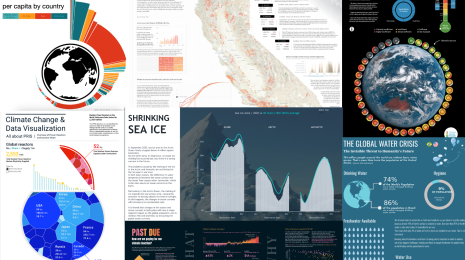 Tableau Public
Visualizing Climate Change: Expert Tips from #TheSDGVizProject Leaders
 22 Abril, 2024
Get expert guidance for visualizing climate data and inspiration from a curated gallery of data visualizations from the DataFam.
22 Abril, 2024
Get expert guidance for visualizing climate data and inspiration from a curated gallery of data visualizations from the DataFam.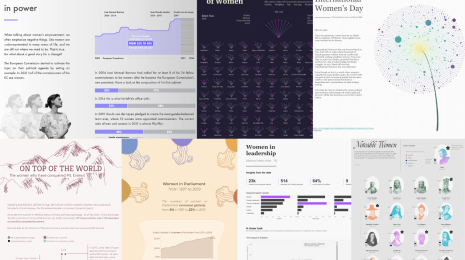 Visualizations
Visualizing Women's Impact to History Through Data Visualization
18 Marzo, 2024
Recognizing and honoring women throughout history with 36 vizzes from the DataFam.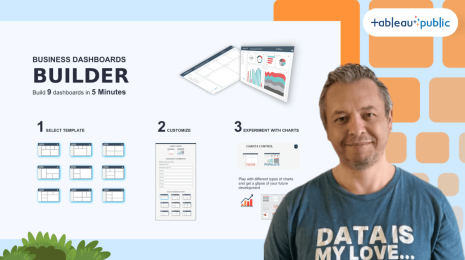 Tableau Public
Behind the Viz: Adrian Zinovei Helps You Design Your Next Dashboard
1 Marzo, 2024
Get to know your fellow Tableau Public authors with Behind the Viz, a blog series where we explore the people and processes behind our featured vizzes.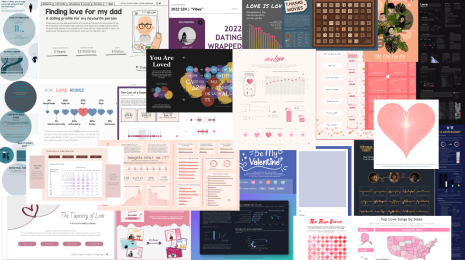 Visualizations
Charting the Heart: Data Visualizations on Love
 14 Febrero, 2024
A curated list of 24 data visualizations celebrating love, relationships, and Valentine’s Day.
14 Febrero, 2024
A curated list of 24 data visualizations celebrating love, relationships, and Valentine’s Day.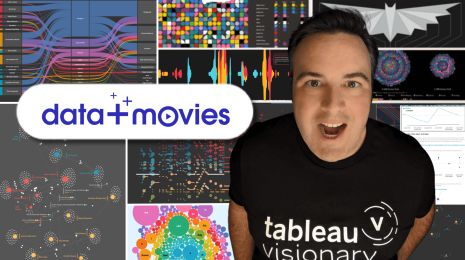 Visualizations
Cinematic Insights: The Art of Movie Analytics
 19 Diciembre, 2023
Tableau Visionary Zach Bowders shares how he found his passion for visualizing movie data.
19 Diciembre, 2023
Tableau Visionary Zach Bowders shares how he found his passion for visualizing movie data. Visualizations
Touchdowns and Trends: College Football Through Data Visualization
 2 Septiembre, 2023
Heated rivalries, conference realignment, stadium capacity, fan maps, game predictions and more. Explore the data visualizations on all things college football.
2 Septiembre, 2023
Heated rivalries, conference realignment, stadium capacity, fan maps, game predictions and more. Explore the data visualizations on all things college football. Tableau Public
8 Most-Favorited Data Visualizations on Tableau Public
27 Julio, 2023
With more than 8 million data vizzes now on Tableau Public, explore the most-favorited vizzes of all time and the authors who shared them. Gartner
How Tableau Showcases the Power of Data, Innovation at Gartner BI Bake-Off
 23 Mayo, 2023
Each year, Gartner invites leaders to take part in their Analytics & BI Bake-Off, where platforms highlight their capabilities across categories, including data management, analysis, storytelling, and innovation.
23 Mayo, 2023
Each year, Gartner invites leaders to take part in their Analytics & BI Bake-Off, where platforms highlight their capabilities across categories, including data management, analysis, storytelling, and innovation. Tips & Techniques
How to Use the Intersects() Calculation in Tableau
 27 Marzo, 2023
Learn about the Intersects calculation in Tableau, which allows you to find spatial intersections via calculated fields at the workbook level—rather than in a join.
27 Marzo, 2023
Learn about the Intersects calculation in Tableau, which allows you to find spatial intersections via calculated fields at the workbook level—rather than in a join. Visualizations
Football Data Visualization Inspiration: 38 Vizzes from the Gridiron
Receiver routes, fan maps, and game predictions—see the curated collection of American football visualizations created in Tableau.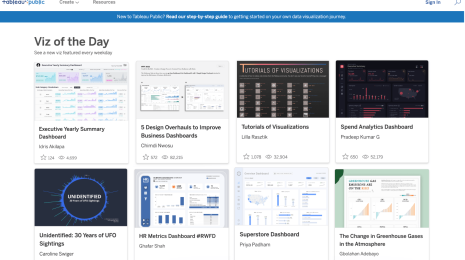 Visualizations
What is Tableau Public’s Viz of the Day?
 4 Febrero, 2023
Learn all about Viz of the Day—a daily dose of inspiration that sparks meaningful data conversations, showcases what’s possible in Tableau, and elevates data visualizations from the Tableau Community.
4 Febrero, 2023
Learn all about Viz of the Day—a daily dose of inspiration that sparks meaningful data conversations, showcases what’s possible in Tableau, and elevates data visualizations from the Tableau Community.
Suscribirse a nuestro blog
Obtenga las últimas actualizaciones de Tableau en su bandeja de entrada.